Going towards cloud and shifting from monolithic model types of clusters to more microservices oriented ones, sure bring you closer towards the cutting-edge tech but add an additional level of complexity.
That is when Istio steps on the scene. Istio is an open-source service mesh, which can make your life easier by adding additional grain level control. On how each pod communicates with the others, utilizing which protocol, and how the cluster intranet works.
Here is a snipped from Istios website, on explaining why you should use it.
https://istio.io/docs/concepts/what-is-istio/#why-use-istio
Istio makes it easy to create a network of deployed services with load balancing, service-to-service authentication, monitoring, and more, with few or no code changes in service code. You add Istio support to services by deploying a special sidecar proxy throughout your environment that intercepts all network communication between microservices, then configure and manage Istio using its control plane functionality…
From here I will proceed explaining how to install Istio on top of existing running Kubernetes cluster.
For the sake of simplicity, I’m gonna be using Google’s GKE engine to deploy a small demo application. And then install Istio so we can see what’s happening under the hood, along with a beautiful dashboard.
The demo app is written by Richard Chesterwood, which you can find all of the files needed on his GitHub page here: https://github.com/DickChesterwood/k8s-fleetman/tree/master/_course_files
Open up the Google Cloud console, go to Kubernetes Engine then Clusters, and click create cluster.
I’m leaving everything as default except for the K8s version and zone. Since I’m in Europe, I want the cluster to be hosted as near as possible to me.
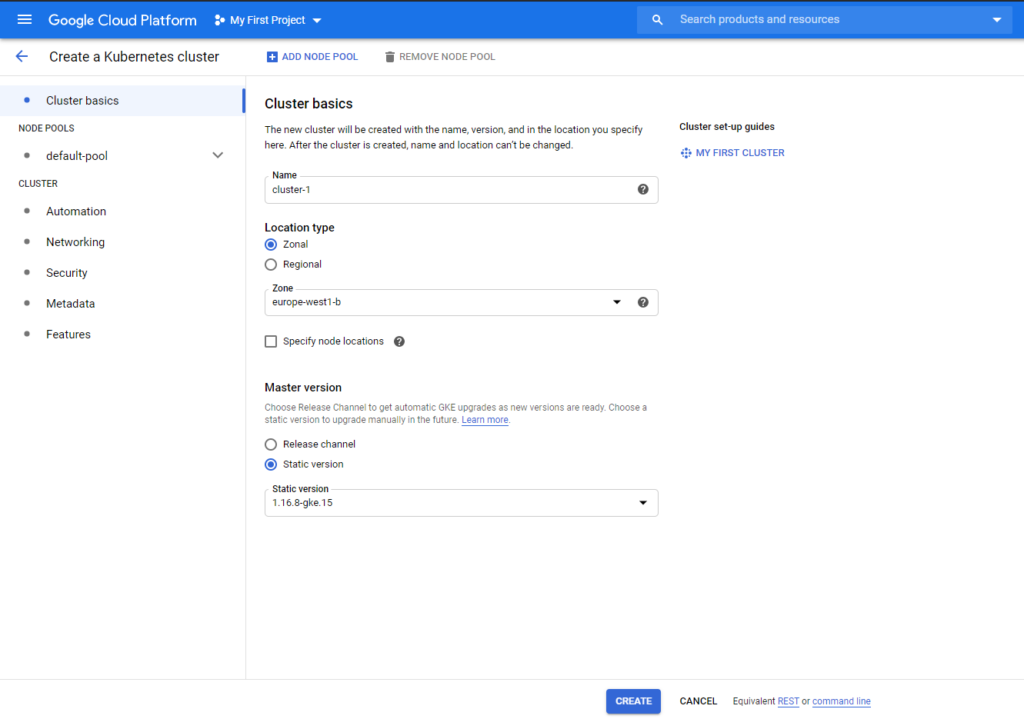
The cluster creation may need a while to finish so go make yourself a coffee :).
In this post I’m using the Cloud Shell provided by Google which is simply a bootstrap instance.
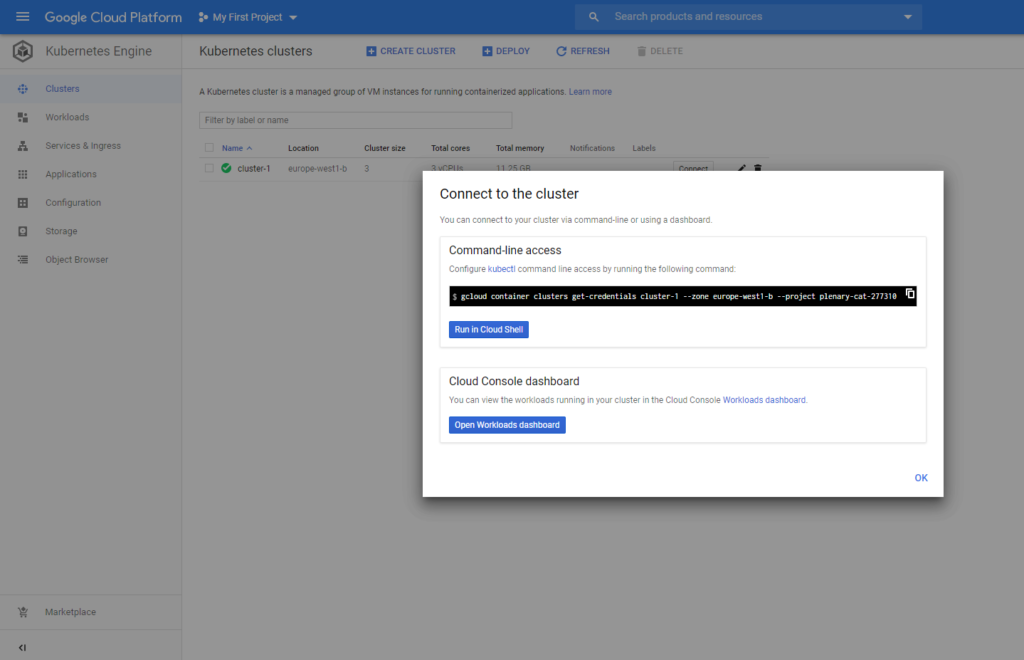
After it’s finished, we will need to connect to it. Click Connect on the right side, and on the prompt just click Run in Cloud Shell.
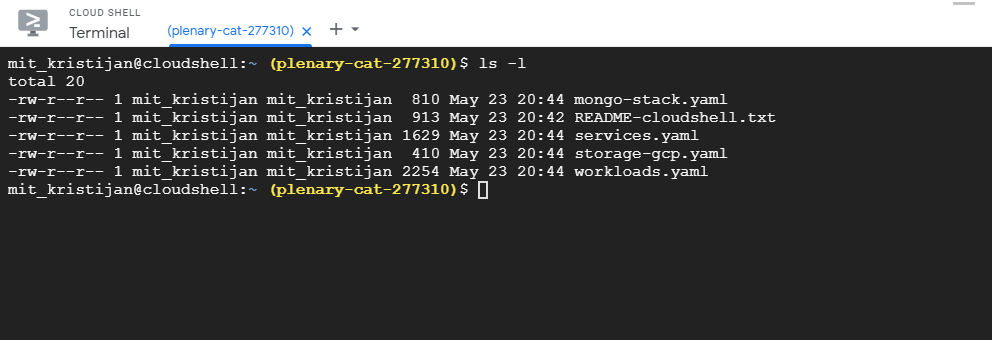
When the Cloud Shell instance starts, it’s a good idea to transfer the files for the demo app. Just drag and drop them in the console

To check if our files are here.
$ ls -l
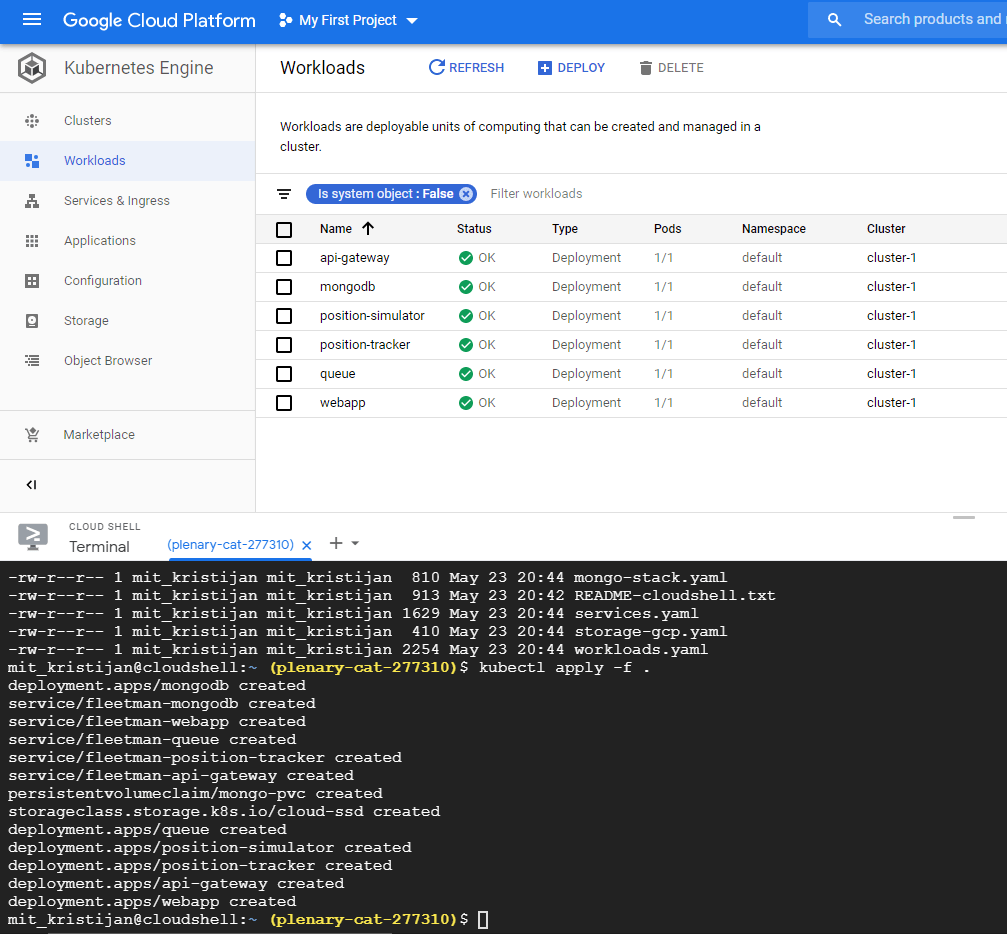
To apply our yaml files, issue the following command.
$ kubectl apply -f .
You can also switch to the Workloads tab to watch the progress. When all of the statuses of the microservices switch to OK you can proceed.
Now in order to open the demo app in the browser, switch to Services & Ingress and find the IP of the load balancer that is attached to the fleetman-webapp.

In my case it the bottom one, with IP of 34.78.51.35.
This is what the app should look like opened in a browser.

If all of the above is correct and in working order we can proceed with installing Istio.
First download the Istio files.
$ curl -L https://istio.io/downloadIstio | sh -
Switch to Istios folder.
$ cd istio-1.6.0
Export the istioctl so we can access it from anywhere.
$ export PATH=$PWD/bin:$PATH
Set the configuration profile. You can read more here https://istio.io/docs/setup/additional-setup/config-profiles/
$ istioctl manifest apply --set profile=demo
And finally, enable the sidecar injection proxies. Since I’m doing all this in the default namespace the command will look like this.
$ kubectl label namespace default istio-injection=enabled
After all the commands above you should have new deployments from Istio in the Workloads tab. If all is green we can proceed.
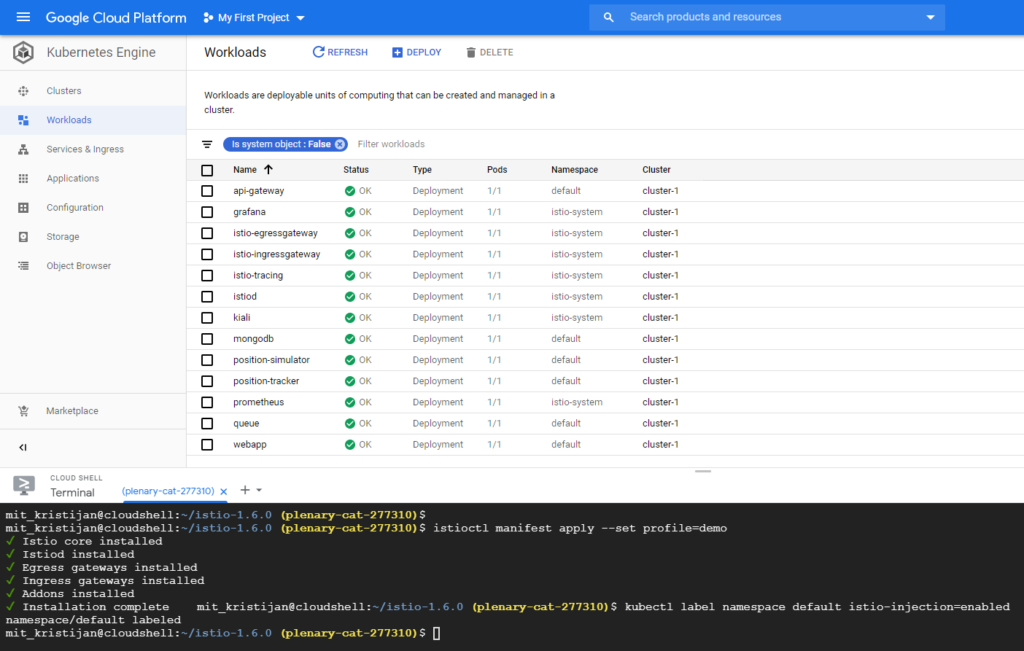
After the install, we will now need to restart all pods in order for the new changes to apply.
$ kubectl delete --all pods

When all the pods come back, we can run the following command to see the Kiali dashboard.
$ istioctl dashboard kiali
You will get a link from the Cloud Shell to access the dashboard, click on it and it will open up in a new window.
The default credentials are admin/admin.
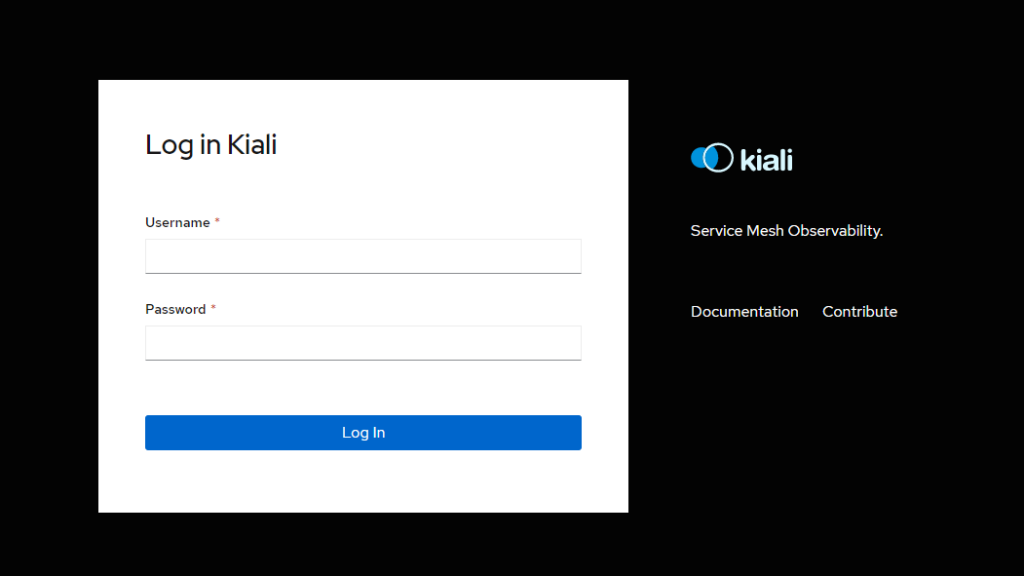
Since I didn’t like the way the dashboard is locking the terminal when it’s running I decided to expose it through a load balancer in order to access it whenever I like.
For that go to Workloads, locate the Kiali and click on it. In the Actions tab go to expose.

The Kiali dashboard is communicating on port 20001, and we want to access it in our browser. Set the port to 80, target port to 20001 and service type as load balancer. Finally click expose.
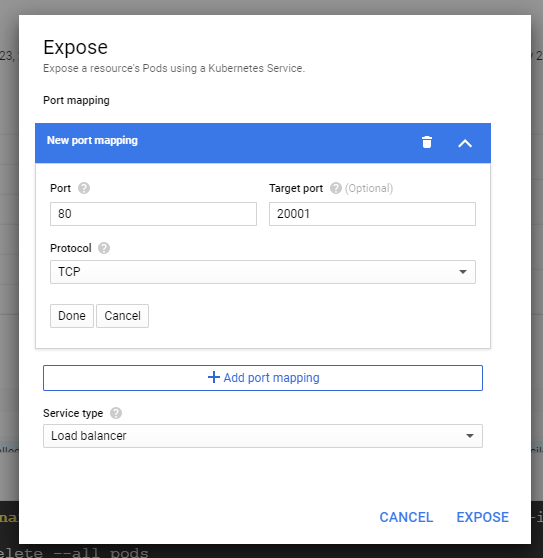
Now if you go back to Services you will see a new load balancer service with external IP address. Click it, and Kiali will open in a new tab.


With this you are all finished. But let’s explore further a bit.
I will run an external website benchmark to simulate some traffic going in and out.
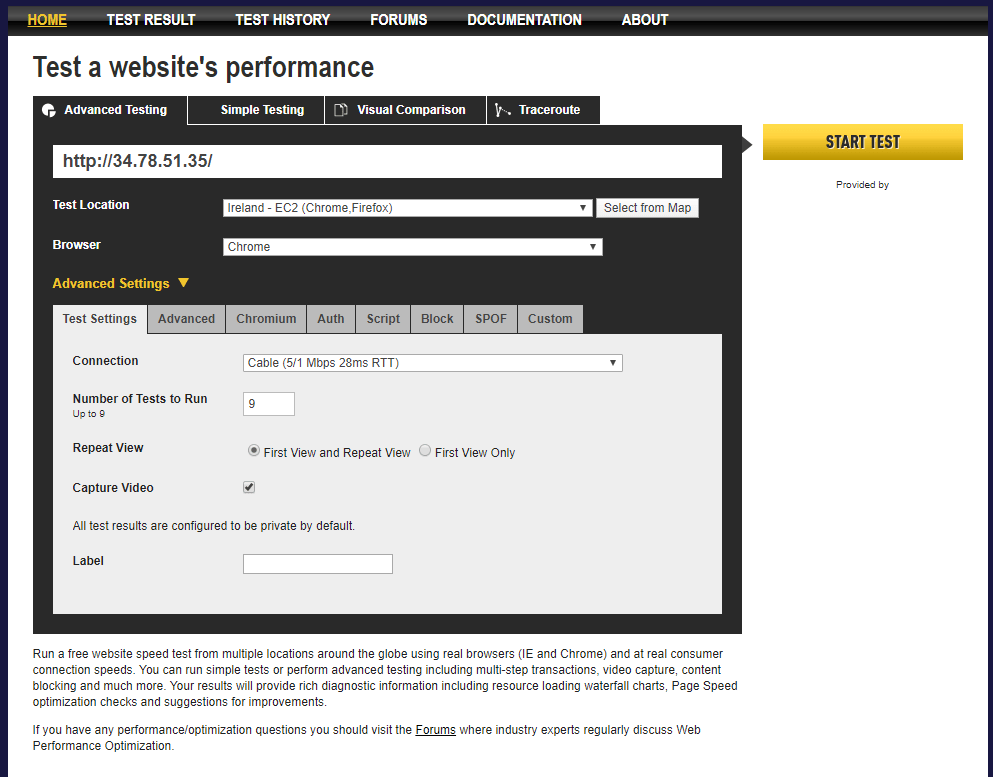
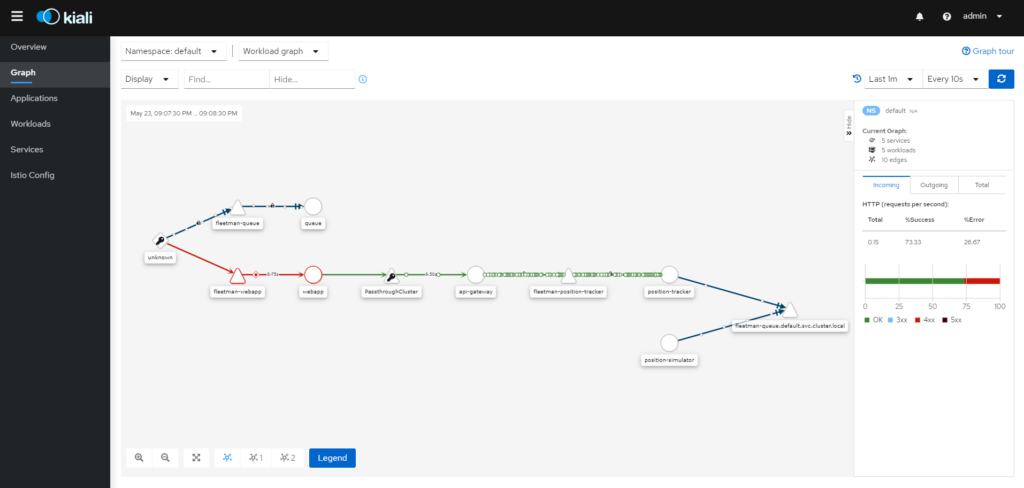
Go to graph, and choose your namespace. In my case it’s default.
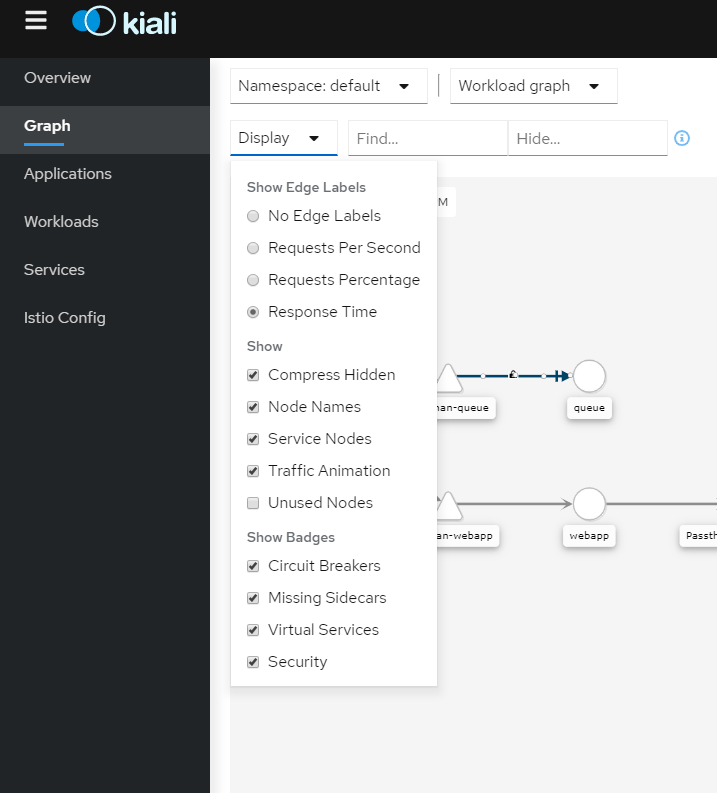
Here is how I’ve set my display options. I want to see the response time from the services.
Full dashboard showing how our services are connected to each other.
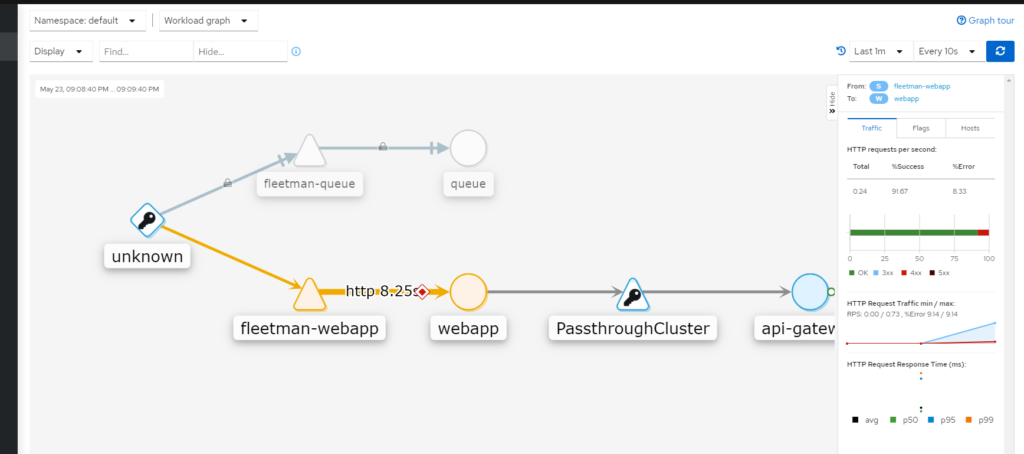
Oh no! Our webapp service is performing poorly, it’s good having it caught red-handed!
More info on the services. We can see we have 33% loss on our inbound requests, displayed right as an error rate.
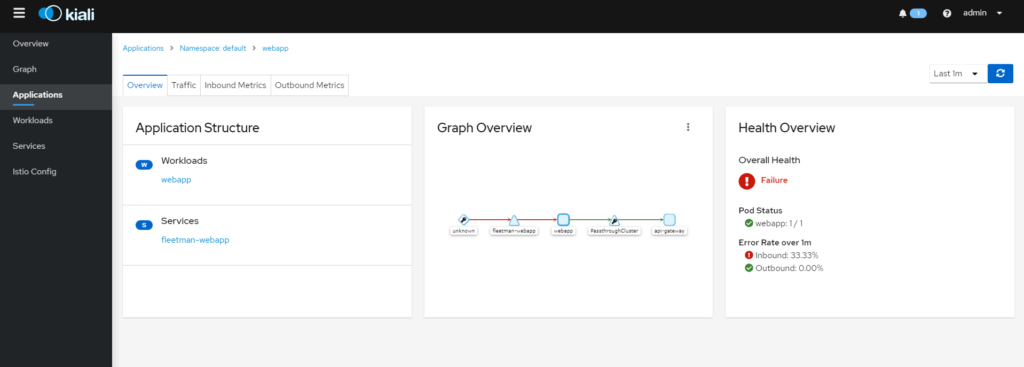
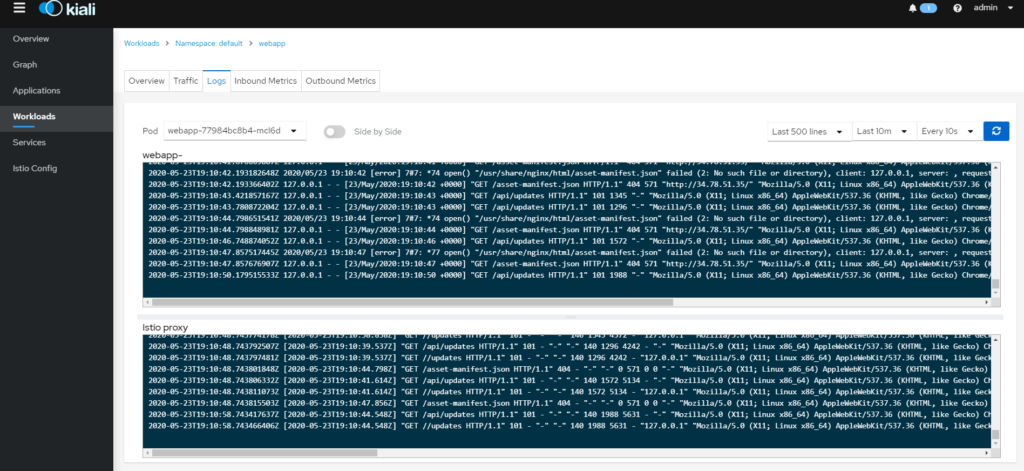
Another really cool option is that you can immediately check the logs, and it’s all displayed right on the same page.
That’s all folks!

